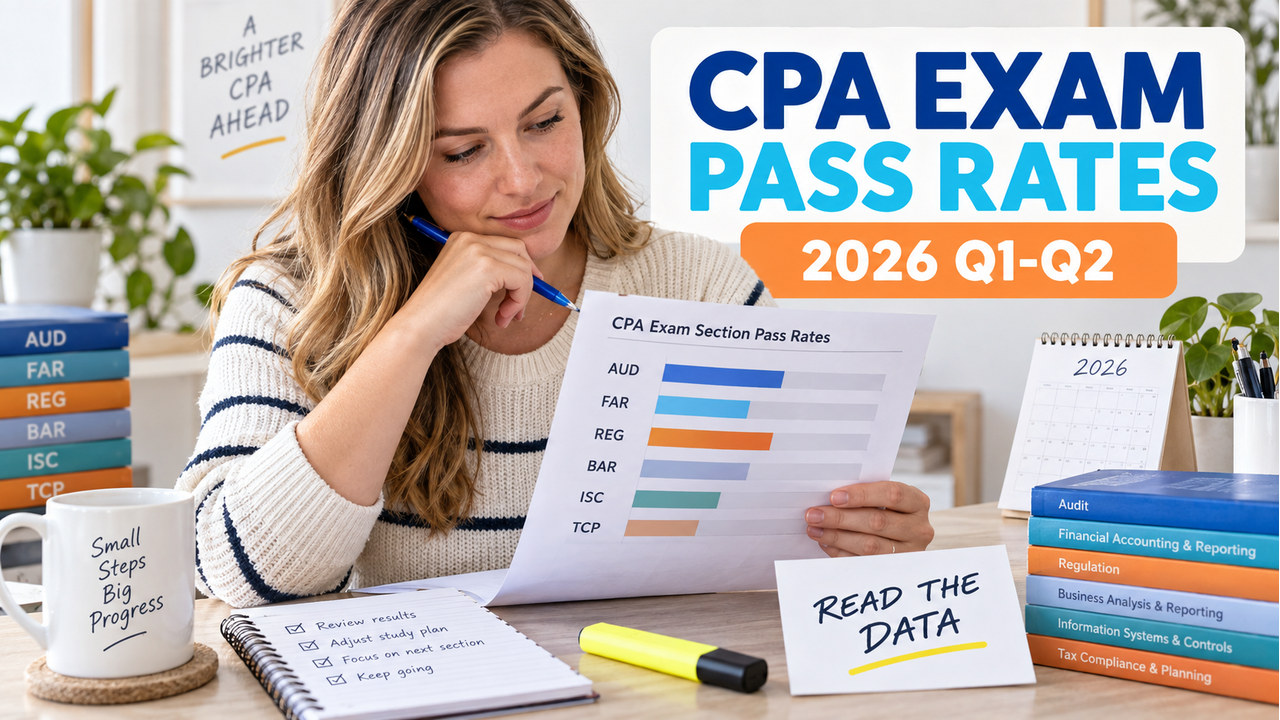

Verified September 15, 2026: the latest official cpa exam pass rates report covers the first two quarters of 2026. Its cumulative rates are AUD 48.65%, FAR 42.95%, REG 66.78%, BAR 43.64%, ISC 67.45%, and TCP 79.53%. These are section-level results for a defined testing population, not your personal probability of passing.
The same AICPA page also shows full-year 2025 data, which is useful context but not a like-for-like comparison with a partial 2026 year. However, use the snapshot to ask better questions about preparation, content coverage, and timing; do not use one headline percentage to declare a section universally easy or hard.
This guide keeps the official numbers separate from the decision you control. Therefore, read the table, then check the current Blueprint, timed practice, and error log before changing your plan. For scoring mechanics, see our CPA Exam Scoring guide.
For a broader preparation path, continue with our CPA Exam Study Guide.
The Current CPA Exam Pass Rates Answer
The current answer is a dated snapshot, not a permanent ranking. AICPA reports each section quarterly and, on the page checked September 15, 2026, provides Q1, Q2, and cumulative 2026 figures plus a 2025 table. Through Q2, TCP is highest at 79.53% and FAR lowest at 42.95%. In other words, that describes the reported groups; it does not predict your result.
AICPA says the CPA Exam is scored and scaled against an established standard. However, a quarterly rate does not prove the exam became easier; a higher rate can mean that period’s candidates were better prepared. For that reason, use the rate as planning context, not as a substitute for the Blueprint and your own evidence.
Official 2026 Q1-Q2 Pass Rates
The table below transcribes the current AICPA report. Specifically, “2026 cumulative” means Q1 and Q2 combined on the page; “2025 cumulative” is the full calendar year. The final column is a simple Q2-minus-Q1 reading point, included to make the quarterly movement visible. It is not a measure of difficulty or a forecast.
| Section | 2025 cumulative | 2026 Q1 | 2026 Q2 | 2026 cumulative | Q2 minus Q1 |
|---|---|---|---|---|---|
| AUD | 48.21% | 47.80% | 49.38% | 48.65% | +1.58 pts |
| FAR | 42.12% | 43.46% | 42.47% | 42.95% | -0.99 pts |
| REG | 63.12% | 66.65% | 66.87% | 66.78% | +0.22 pts |
| BAR | 41.94% | 41.30% | 45.62% | 43.64% | +4.32 pts |
| ISC | 67.79% | 66.79% | 67.98% | 67.45% | +1.19 pts |
| TCP | 77.65% | 79.28% | 79.75% | 79.53% | +0.47 pts |
Two boundaries matter. First, Q1 and Q2 are both 2026 quarters, while 2025 cumulative covers four quarters. Second, the table reports the share of candidates who passed a section in the reported period; it does not show the percentage of questions answered correctly. In other words, keep those boundaries visible when you summarize the numbers for a study group or a client.
What the 2026 Numbers Suggest—and What They Do Not
The clearest descriptive signal is the spread between reported cumulative rates: FAR is 42.95%, AUD 48.65%, and BAR 43.64%, while REG, ISC, and TCP are higher. For example, that spread may show where more preparation support is useful, but it cannot name a universal “easy” section because the groups and backgrounds differ.
Quarterly movement is easy to overread. BAR rises 4.32 points from Q1 to Q2, while FAR falls 0.99. Nevertheless, the movement may reflect candidates tested, preparation, section choice, or ordinary variation. It is not enough evidence to claim a difficulty change, a scoring-standard change, or the same change in your own odds.
Use the following distinction whenever you quote a number:
- The rate can describe: how the reported candidate group performed on a named section during a named quarter or cumulative period.
- The rate cannot prove: your personal pass probability, the percentage of questions needed to pass, or a guaranteed difficulty order among sections.
- The comparison can support: a decision to inspect the Blueprint, review your practice evidence, and look for a content-area pattern.
- The comparison should not replace: a jurisdiction rule, a score notice, a Candidate Performance Report, or a plan based on your own preparation record.
Core and Discipline Rates Are Different Decisions
The current CPA Exam has three Core sections—AUD, FAR, and REG—and one Discipline choice from BAR, ISC, or TCP. By contrast, read the groups separately: Core is required for everyone, while each candidate selects one Discipline. That choice changes the candidate mix and weakens a simple “highest equals easiest” conclusion.
For Core, use the rate as a conversation starter. In practice, review the current Blueprint, tested skills, your background, and the time you can protect. A lower group rate may call for a structured plan; it does not mean you should expect failure.
For Discipline, fit matters even more. TCP has the highest 2026 cumulative rate in this report, but systems experience may fit ISC better for one candidate, while work or coursework may fit BAR or TCP for another. Similarly, the table can prompt comparison; it cannot choose the Discipline for you.
Scoring Rules Behind the Pass-Rate Table
Pass rates are not percentages correct because the reported CPA Exam score is scaled. AICPA and NASBA state that scores use a 0-to-99 scale and that 75 or higher passes. In other words, a 75 does not mean 75% correct, and no fixed correct-answer percentage guarantees a pass.
The exam is not curved against the testing-period group. Therefore, candidates are evaluated against an established standard, so a quarterly rate is background—not a personal score calculator.
The score also combines different item types. In addition, AUD, FAR, REG, BAR, and TCP use a 50% MCQ and 50% TBS weighting, while ISC uses 60% MCQs and 40% TBSs. Your study evidence should therefore include both the knowledge recall needed for MCQs and the application work needed for TBSs; a single quiz percentage is too narrow to stand in for readiness.
Finally, do not confuse a pass-rate change with a scoring-policy change. This page reports outcomes. If AICPA changes the Blueprint, delivery, or scoring explanation, treat it as a new update and recheck the official page.
Build a Study Decision From the Data
Here is the original Rate-to-Readiness Card for using cpa exam pass rates responsibly. In short, it keeps the public statistic on one side and your private evidence on the other. The method is deliberately small so it can guide a decision without pretending to be an official score predictor.
- First, fix the evidence boundary. Write “AICPA, checked September 15, 2026, 2026 Q1-Q2” beside the rate. If you are comparing with 2025, write “full year” beside it. This prevents a partial year from becoming a false trend.
- Next, check the content boundary. Open the current Blueprint for the exact section and list the content areas you can explain, apply, and still miss under time pressure.
- Then, check the performance boundary. Review timed MCQ and TBS work, then group your misses in an error log. Look for a repeated concept or task type instead of reacting to one bad set.
- Finally, choose one next action. Continue the plan if your evidence is improving, target the repeated content gap if it is stable, or build a retake review around the official score notice and CPR when those documents are available.
For example, a fictional FAR candidate sees the 42.95% cumulative figure and feels discouraged. The rate alone does not tell that candidate to switch topics or change sections. If the error log shows correct calculations but weak task-based-simulation documentation, the next action is narrower: practice that task pattern, review the related Blueprint skill, and recheck timed work. The public rate supplied context; the private evidence supplied the decision.

Use the Pass Rates Without Overreacting
A checklist is useful on score-day or when a new quarterly report appears. First, mark what you have; then act on the first missing evidence rather than the most dramatic percentage.
If you are discussing results with someone else, keep the report anonymous. A section, quarter, and preparation pattern are enough; never share a candidate ID, NTS number, password, confirmation code, or personal score in a public worksheet.
If You Passed or Need a Retake
If you passed, save the official Score Notice, check your board’s current credit and application instructions, and confirm your own timeline before moving to the next section. The group rate is context; your credit window and jurisdiction rules control.
If you did not pass, do not use the lowest published rate as the explanation. Instead, read the Score Notice and Candidate Performance Report when available, pair the CPR with your practice error log, and build a retake plan around a documented gap rather than simply adding hours.
A score near 75 does not create a universal “almost passed” rule, and the rate cannot tell you how many weeks are required. Use the result, timing, content coverage, and task performance together. Confirm jurisdiction-specific rules with your Board of Accountancy.
Common Questions About CPA Exam Pass Rates
Does a 75 CPA Exam score mean I answered 75% correctly?
No. AICPA and NASBA describe the score as a 0-to-99 scaled score. A 75 is the passing standard, not a percentage-correct result, and no fixed correct-answer percentage guarantees a pass.
Does the highest CPA Exam pass rate prove that section is easiest?
No. A rate describes a reported candidate group during a defined period. Candidate preparation, section choice, tested forms, and the Core-versus-Discipline structure all limit a universal difficulty ranking.
Can I compare the 2026 Q1-Q2 rate directly with the 2025 rate?
You can use 2025 full-year data as context, but it is not a like-for-like period. Label the time spans clearly and avoid treating the difference as a forecast for the rest of 2026.
What should I do with the latest CPA Exam pass rates?
Record the AICPA check date and quarter range, open the current Blueprint, review timed MCQ and TBS evidence, and use your error log to choose one next action. Do not make a section decision from the percentage alone.
What to Do Next
Write one line in your study record: “AICPA pass-rate page checked September 15, 2026; 2026 Q1-Q2; section under review; personal evidence still missing.” Then, before changing your plan, fill the first missing field—Blueprint coverage, timed MCQ/TBS work, or error-log pattern. This makes the official update useful without turning a group statistic into a promise about you.
Return to the AICPA page when a later quarter is added or a reported figure is corrected. Until then, treat the table as context and let your own documented preparation decide the next study action.
Sources and Update Log
Official pages checked September 15, 2026:
- AICPA scoring and pass rates — 2026 Q1-Q2 and 2025 section tables, scaled-score terminology, and MCQ/TBS weighting.
- NASBA Score Information — the 75 passing standard, non-percentage interpretation, non-curved scoring, and score mechanics.
- AICPA Trust in the CPA Exam — context for CPA Evolution, Blueprint changes, and limits on cross-year comparisons.
- AICPA CPA Exam Blueprints guide — why the current Blueprint is the right candidate-level content check.
Update owner: CPA Exam Prep content team, with AICPA as the source owner for pass-rate tables and scoring terminology. Refresh when AICPA publishes a new quarter, corrects a rate, changes the score explanation, or publishes a material Blueprint or exam-format update.